Dashboards in MultiPress: the right overview at the right moment
29 January 2021
 The power of dashboards
Business is a game of numbers. Because financial and production figures tell you whether sales revenue is on track, whether costs are under control and how financially successful your business is at any given time. In other words, numbers are the language of better business ...
But data alone is not enough. It's about having well-structured and graphically strong figures on a silver platter. In order to be able to oversee all business-critical data with a simple push of a button in one convenient overview, to take management decisions and thus keep your company on track.
Time-consuming?
For many managers, also in the graphic industry, this is a time-consuming task. Data often comes from different software packages and do not always report on the same data. If they are up-to-date at all ...
Bringing all those figures together in an orderly fashion is not always easy, can easily take up several hours and often leaves too much room for interpretation.
Only an integrated package such as MultiPress can offer relief. It links various processes and has a reporting module. But such a report is not always easy to read. Therefore Dataline chose the MultiPress Dashboard for a fresh approach with a number of eye-catching advantages.
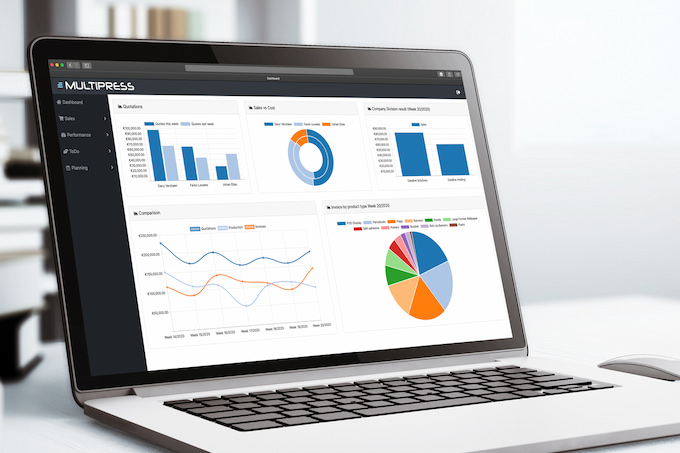
Real-time and clear
Dashboards are easy to set up and only contain the information you need at that moment. You create the dashboards once with the key performance indicators (KPIs) you frequently need. From then on, all the information, which is also clearly displayed in tables or charts, is just a click away.
With the MultiPress Dashboard, you can analyse at a glance which types of jobs your company processes most, which jobs are the most profitable, which type of quotes have the highest success rate, the quantity and type of orders that are in progress or planned...
You name it, if it exists in MultiPress, it can be displayed on a dashboard in a clear and graphic manner. Broken down by department, by product group, comparisons over time or with other parameters ... you name it!
Everything is connected
Reports are often a rear-view mirror that require a lot of interpretation and research. Not so with the MultiPress Dashboard! Because your dashboards are 100% integrated with all your business processes, you get a whole range of practical possibilities:
Is a certain type of job less profitable than expected? From your dashboard, with one click, you can bring up the file and start analysing it in more detail.
Is the planning for the coming days threatening to run out of steam? Because you have insight into which type of quotations convert more easily and which are still open, you can easily call those specific customers from the dashboard.
Discover the trends in your company figures
In many management discussions, it is often a case of looking for business-critical trends that are 'hidden' in the figures. Thanks to the graphic nature of the MultiPress Dashboard, any trends are strongly brought to the surface visually:
What about variable costs? Are you not paying your suppliers too much? One press of a button tells you everything you need to know about market prices and suppliers.
Do you know whether overhead costs are under control? Find out everything about wages and other costs in a handy graph.
Motivating
People often think of reporting and dashboards as something for the management level. Nothing could be further from the truth. Because precisely because the data on all business processes is available in real time, and because dashboards are completely modular and can also be shown on other screens, you can think up totally new applications for them. Think of customised dashboards for specific functions such as order supervisors, planners or financial managers. Handy, efficient and motivating!
Clients XL Reklame (BE) and Buroform (BE) completely rely on their MultiPress dashboards.
XL Reklame installed a large screen in the company that displays the current order status in real-time, which improves the involvement of employees with the company.
At Buroform, several dashboards are placed throughout the company building, personalised every department. This way, production can immediately see which orders need to be printed, the accountants can see which quotations need to be paid, you name it!
Video testimonials
Dirk Teughels, manager XL Reklame, and Jesse Marynen, Chief Print Officer Buroform, can't imagine their companies without them. They explain why in the videos below:
Do you also need more overview in your print media company?
Would you like to experience the versatility, graphic character and ease of use of the MultiPress Dashboards for yourself? Request a free demo today! Once you have discovered the versatility of dashboards, it will be hard to believe how you managed without them all those years ...